Contents
Himalayan Springs: Flow & Water Quality
Spring discharge
clear,close('all'),clc
stitle = 'Himalayan Spring Analyses';
t = [datetime(2023,11,8),datetime(2023,11,22),datetime(2023,12,8),datetime(2023,12,22),...
datetime(2024, 1,8),datetime(2024, 1,22),datetime(2024, 2,8),datetime(2024, 2,22),...
datetime(2024, 3,8),datetime(2024, 3,22),datetime(2024, 4,8),datetime(2024, 4,22),...
datetime(2024, 5,8),datetime(2024, 5,22),datetime(2024, 6,8),datetime(2024, 6,22),...
datetime(2024, 7,8),datetime(2024, 7,22),datetime(2024, 8,8),datetime(2024, 8,22)];
fname = 'springs.csv';
data = readtable(fname);
snames = data.Spring;
q = table2array(data(:,2:21));
fsize = 16; lwidth = 2; msize = 10; psize = [100,100,1200,800];
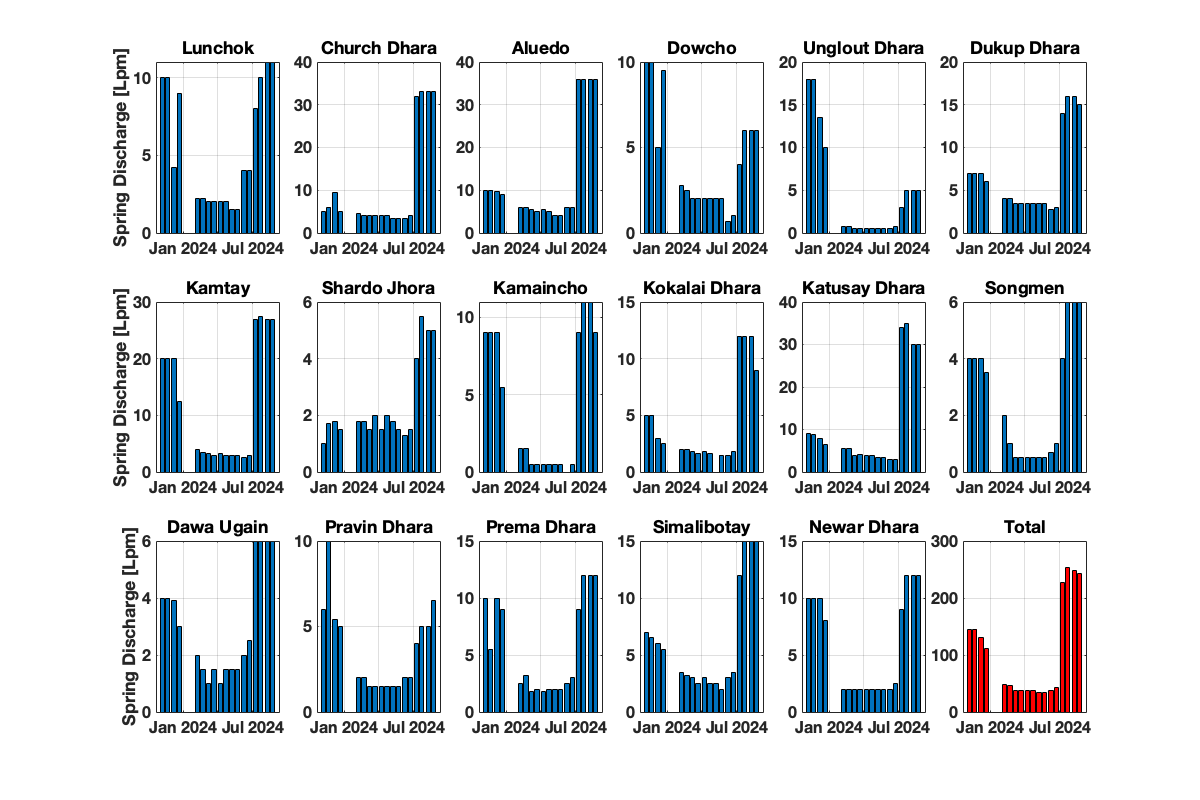
figure
for i=1:17
subplot(3,6,i)
bar(t,q(i,:))
grid,title(snames(i))
if rem(i,6)==1, ylabel('Spring Discharge [Lpm]'), end
set(gca,'fontsize',fsize','fontweight','bold')
end
subplot(3,6,18)
bar(t,sum(q),'r')
grid,title('Total')
set(gca,'fontsize',fsize','fontweight','bold')
set(gcf,'Position',psize,'color','white')
Water Quality Variables
clear,close('all'),clc
stitle = 'Himalayan Spring Analyses: West Bengal, India';
fname = 'Springdata.csv';
data = readtable(fname);
springs = data.Name;
lat = data.Lat;
lon = data.Lon;
elev = data.Alt;
ph = data.pH;
q = data.Q;
temp = data.Temp;
ec = data.EC;
tds = data.TDS;
salts = data.Salts;
fsize = 18; lwidth = 2; msize = 10; psize = [100,100,1200,800];
figure
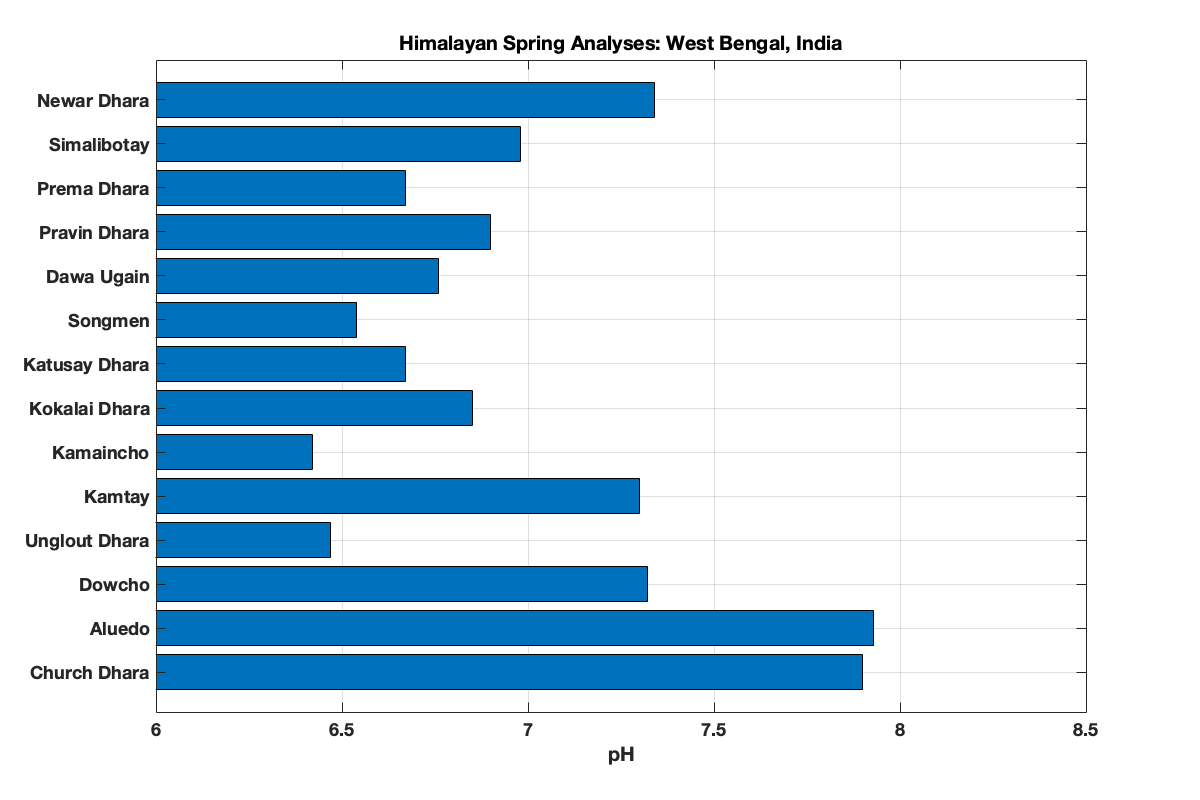
barh(springs,ph)
grid,xlim([6,8.5]),xlabel('pH')
title(stitle)
set(gca,'fontsize',fsize','fontweight','bold')
set(gcf,'Position',psize,'color','white')
figure
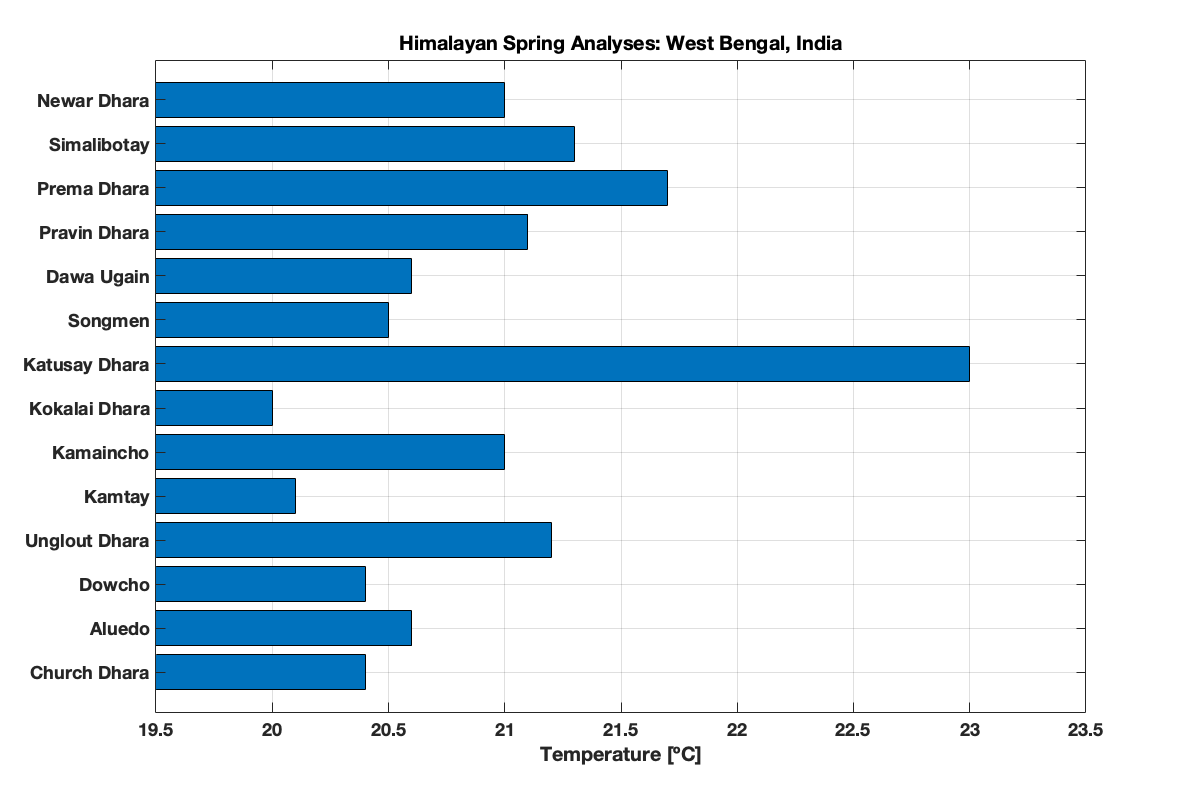
barh(springs,temp)
grid,xlim([19.5,23.5]),xlabel('Temperature [ºC]')
title(stitle)
set(gca,'fontsize',fsize','fontweight','bold')
set(gcf,'Position',psize,'color','white')
figure
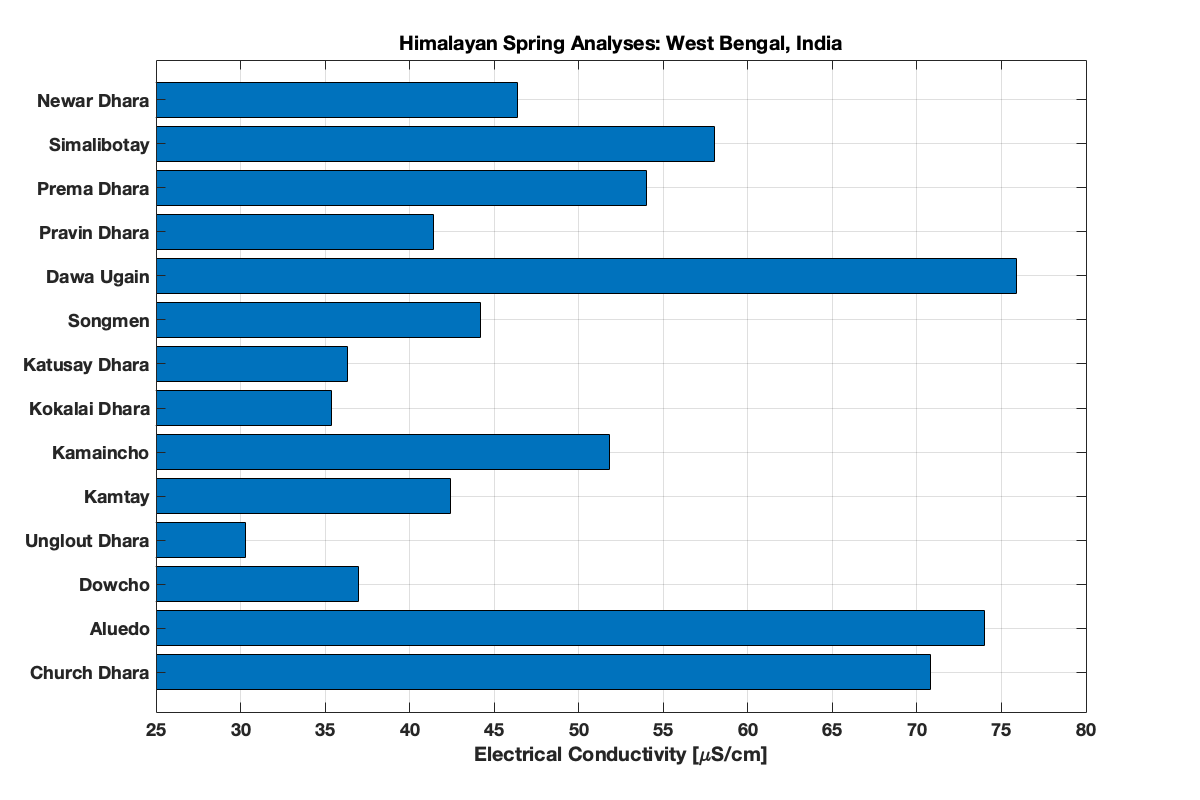
barh(springs,ec)
grid,xlim([25,80]),xlabel('Electrical Conductivity [\muS/cm]')
title(stitle)
set(gca,'fontsize',fsize','fontweight','bold')
set(gcf,'Position',psize,'color','white')
figure
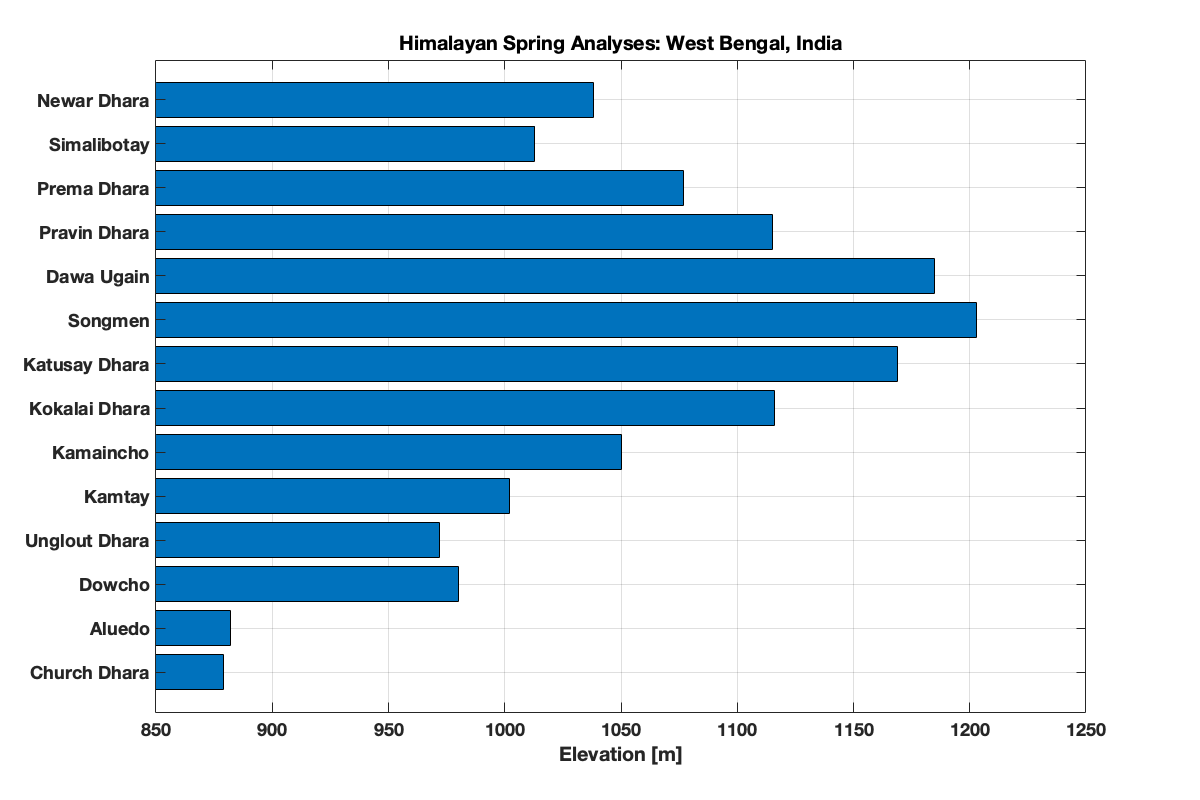
barh(springs,elev)
grid,xlim([850,1250]),xlabel('Elevation [m]')
title(stitle)
set(gca,'fontsize',fsize','fontweight','bold')
set(gcf,'Position',psize,'color','white')
figure
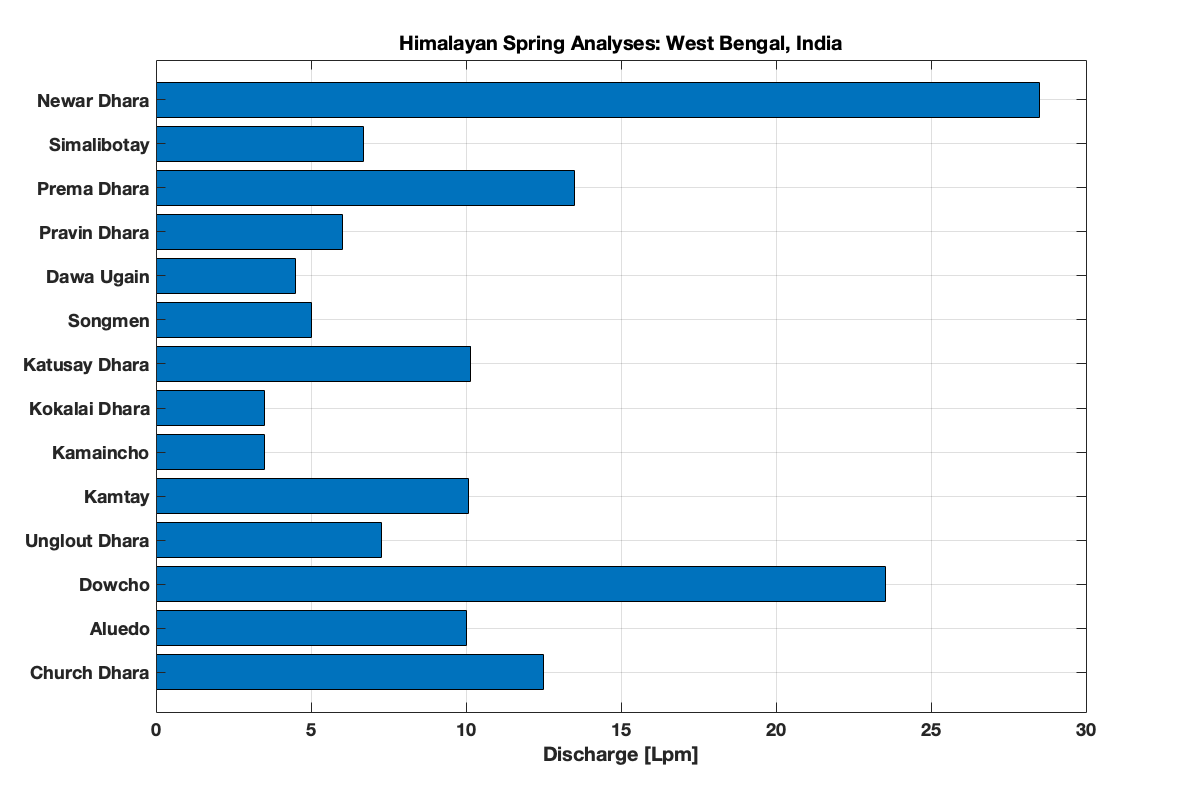
barh(springs,q)
grid,xlim([0,30]),xlabel('Discharge [Lpm]')
title(stitle)
set(gca,'fontsize',fsize','fontweight','bold')
set(gcf,'Position',psize,'color','white')
figure
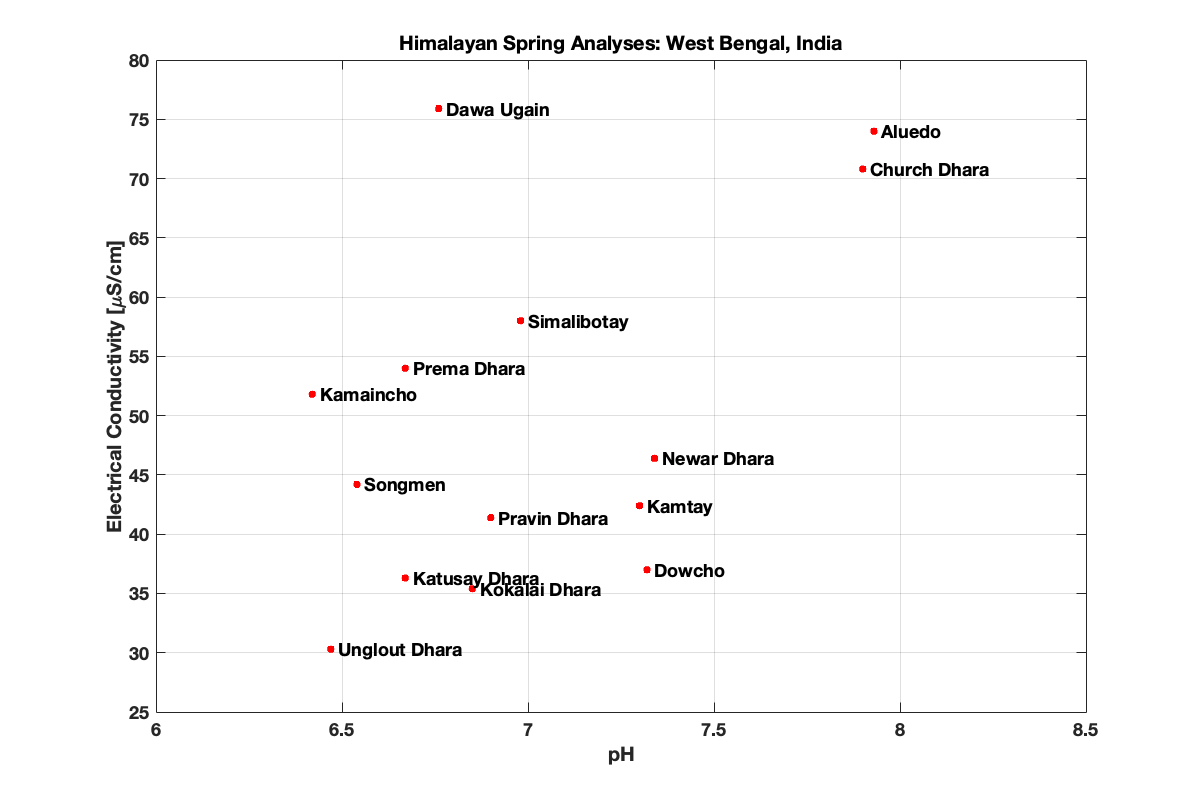
plot(ph,ec,'r.','markersize',20)
grid,xlim([6,8.5]),ylim([25,80])
xlabel('pH')
ylabel('Electrical Conductivity [\muS/cm]')
title(stitle)
for i=1:length(ph)
text(ph(i)+.02,ec(i),springs(i),'fontsize',fsize,'fontweight','bold')
end
set(gca,'fontsize',fsize','fontweight','bold')
set(gcf,'Position',psize,'color','white')
figure
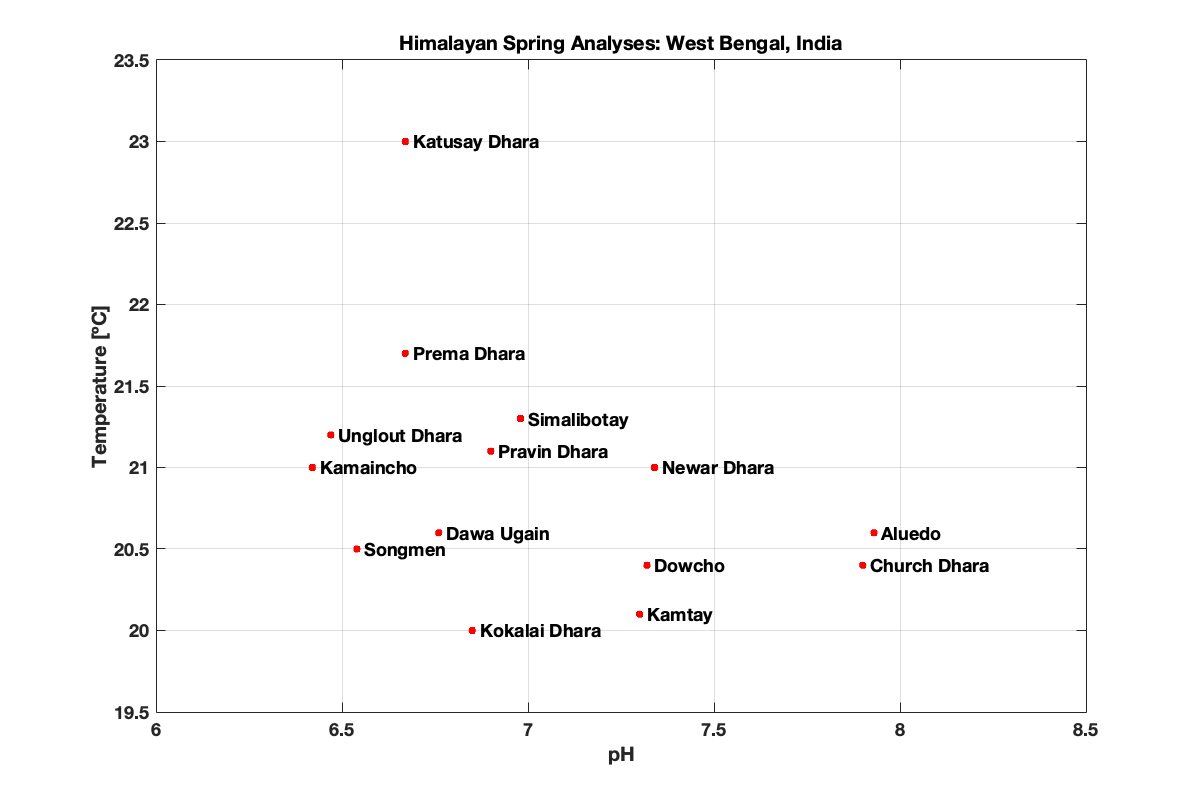
plot(ph,temp,'r.','markersize',20)
grid,xlim([6,8.5]),ylim([19.5,23.5])
xlabel('pH')
ylabel('Temperature [ºC]')
title(stitle)
for i=1:length(ph)
text(ph(i)+.02,temp(i),springs(i),'fontsize',fsize,'fontweight','bold')
end
set(gca,'fontsize',fsize','fontweight','bold')
set(gcf,'Position',psize,'color','white')
figure
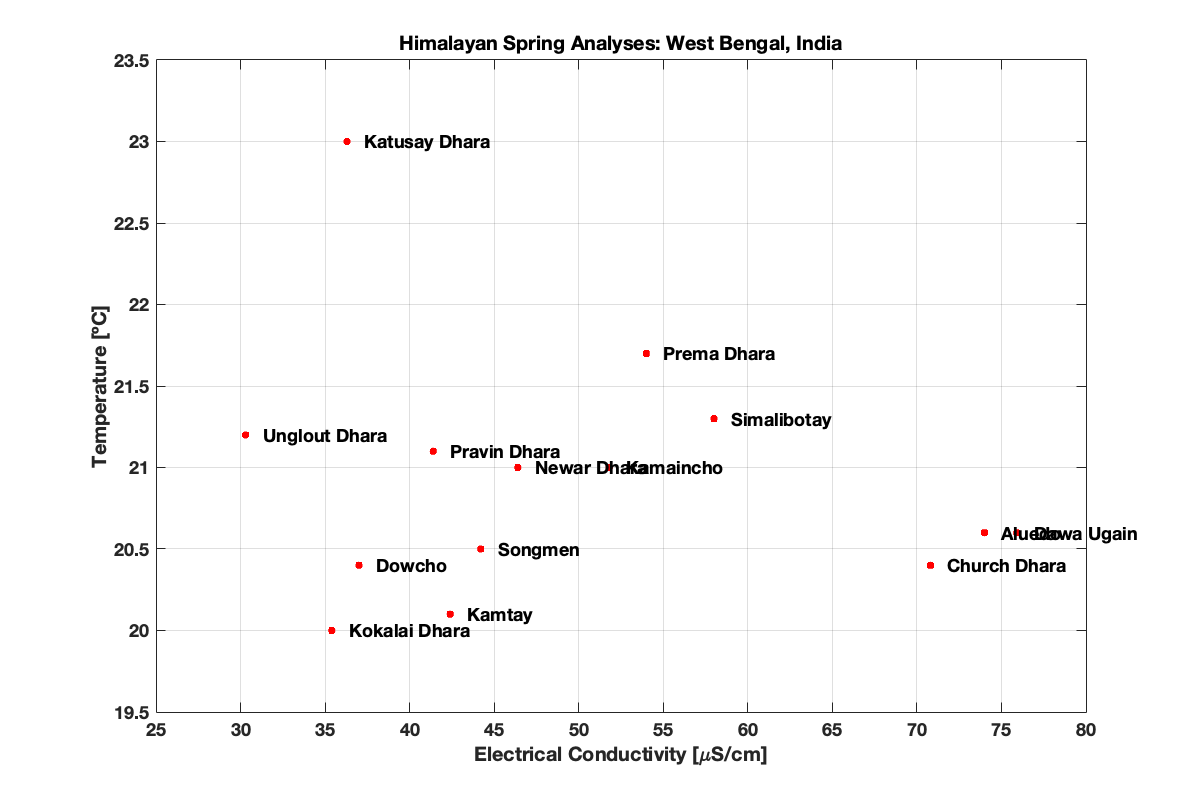
plot(ec,temp,'r.','markersize',20)
grid,xlim([25,80]),ylim([19.5,23.5])
xlabel('Electrical Conductivity [\muS/cm]')
ylabel('Temperature [ºC]')
title(stitle)
for i=1:length(ph)
text(ec(i)+1,temp(i),springs(i),'fontsize',fsize,'fontweight','bold')
end
set(gca,'fontsize',fsize','fontweight','bold')
set(gcf,'Position',psize,'color','white')
figure
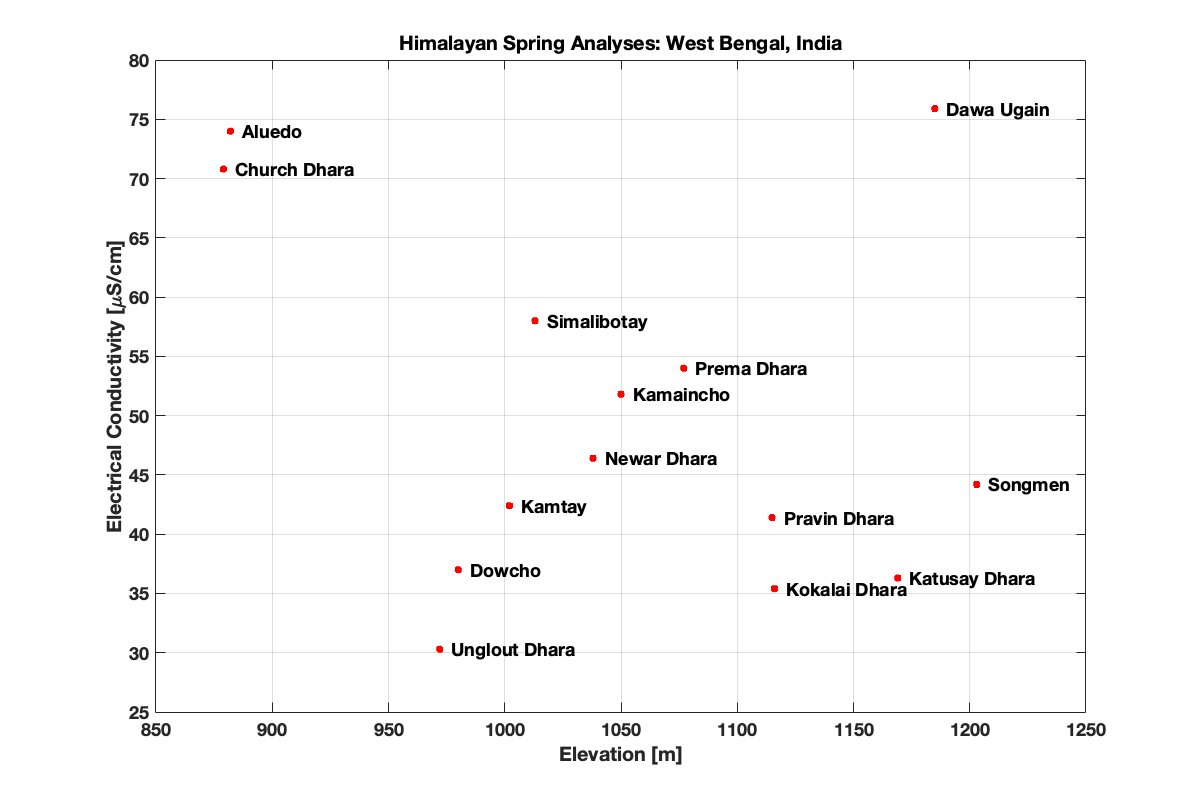
plot(elev,ec,'r.','markersize',20)
grid,xlim([850,1250]),ylim([25,80])
xlabel('Elevation [m]')
ylabel('Electrical Conductivity [\muS/cm]')
title(stitle)
for i=1:length(ph)
text(elev(i)+5,ec(i),springs(i),'fontsize',fsize,'fontweight','bold')
end
set(gca,'fontsize',fsize','fontweight','bold')
set(gcf,'Position',psize,'color','white')
figure
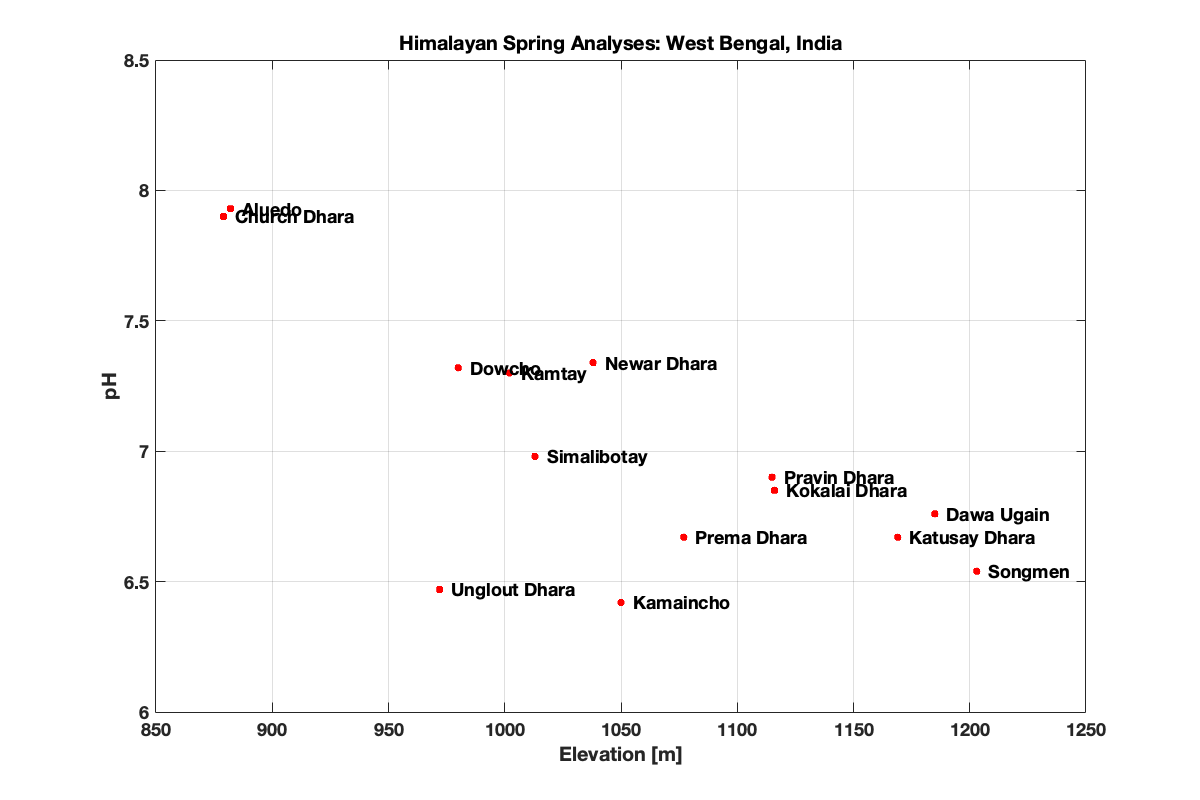
plot(elev,ph,'r.','markersize',20)
grid,xlim([850,1250]),ylim([6,8.5])
xlabel('Elevation [m]')
ylabel('pH')
title(stitle)
for i=1:length(ph)
text(elev(i)+5,ph(i),springs(i),'fontsize',fsize,'fontweight','bold')
end
set(gca,'fontsize',fsize','fontweight','bold')
set(gcf,'Position',psize,'color','white')
figure
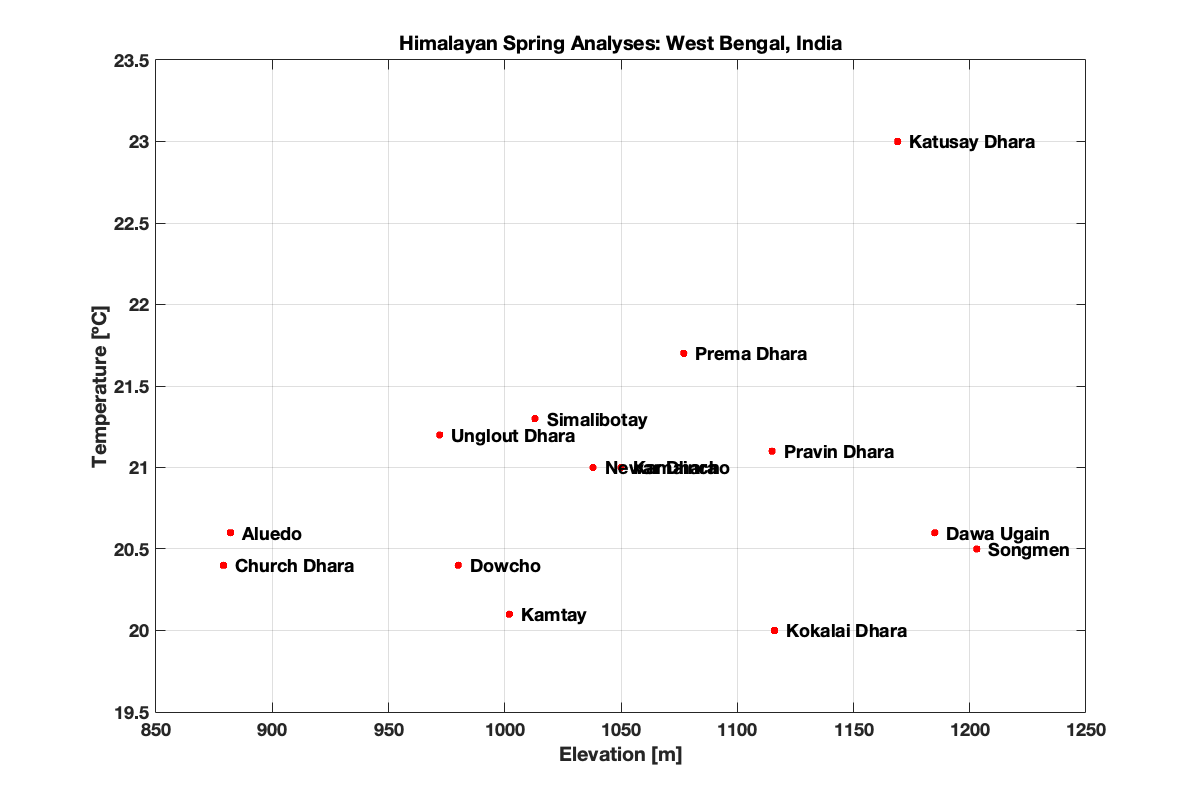
plot(elev,temp,'r.','markersize',20)
grid,xlim([850,1250]),ylim([19.5,23.5])
xlabel('Elevation [m]')
ylabel('Temperature [ºC]')
title(stitle)
for i=1:length(ph)
text(elev(i)+5,temp(i),springs(i),'fontsize',fsize,'fontweight','bold')
end
set(gca,'fontsize',fsize','fontweight','bold')
set(gcf,'Position',psize,'color','white')
figure
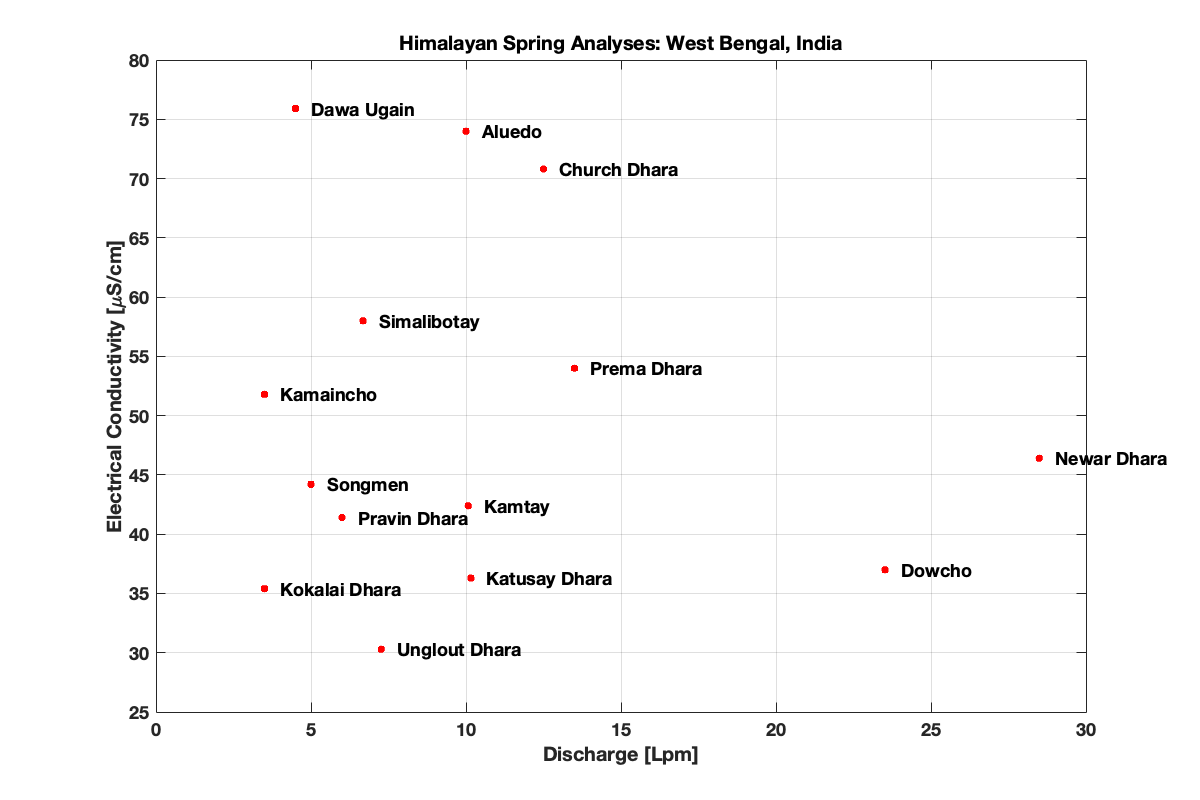
plot(q,ec,'r.','markersize',20)
grid,xlim([0,30]),ylim([25,80])
xlabel('Discharge [Lpm]')
ylabel('Electrical Conductivity [\muS/cm]')
title(stitle)
for i=1:length(ph)
text(q(i)+.5,ec(i),springs(i),'fontsize',fsize,'fontweight','bold')
end
set(gca,'fontsize',fsize','fontweight','bold')
set(gcf,'Position',psize,'color','white')
figure
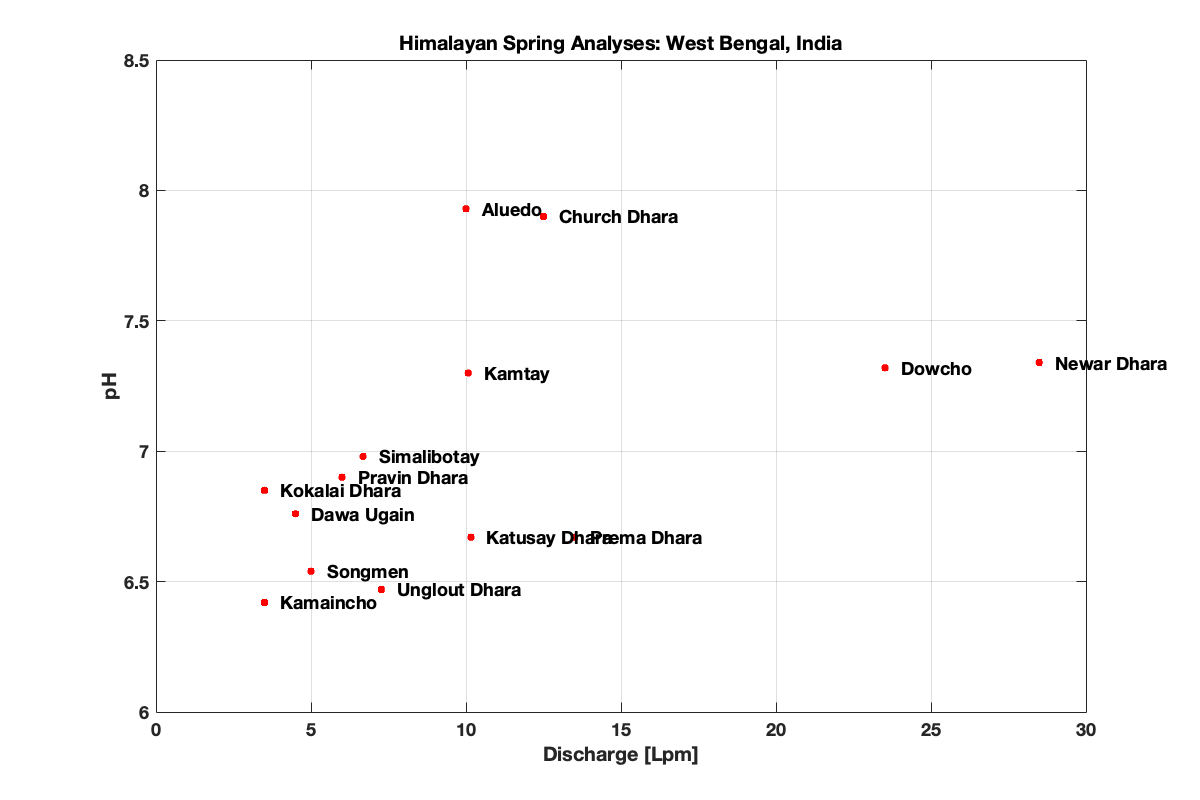
plot(q,ph,'r.','markersize',20)
grid,xlim([0,30]),ylim([6,8.5])
xlabel('Discharge [Lpm]')
ylabel('pH')
title(stitle)
for i=1:length(ph)
text(q(i)+.5,ph(i),springs(i),'fontsize',fsize,'fontweight','bold')
end
set(gca,'fontsize',fsize','fontweight','bold')
set(gcf,'Position',psize,'color','white')
figure
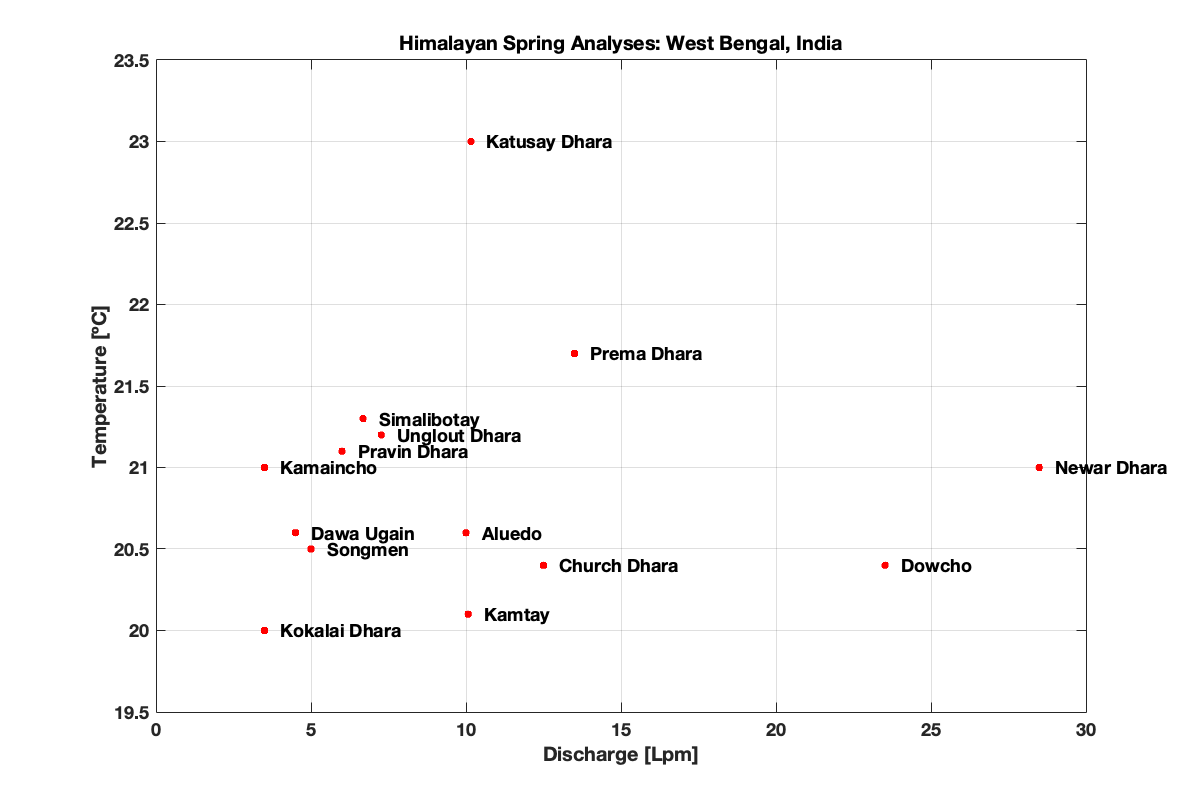
plot(q,temp,'r.','markersize',20)
grid,xlim([0,30]),ylim([19.5,23.5])
xlabel('Discharge [Lpm]')
ylabel('Temperature [ºC]')
title(stitle)
for i=1:length(ph)
text(q(i)+.5,temp(i),springs(i),'fontsize',fsize,'fontweight','bold')
end
set(gca,'fontsize',fsize','fontweight','bold')
set(gcf,'Position',psize,'color','white')
figure
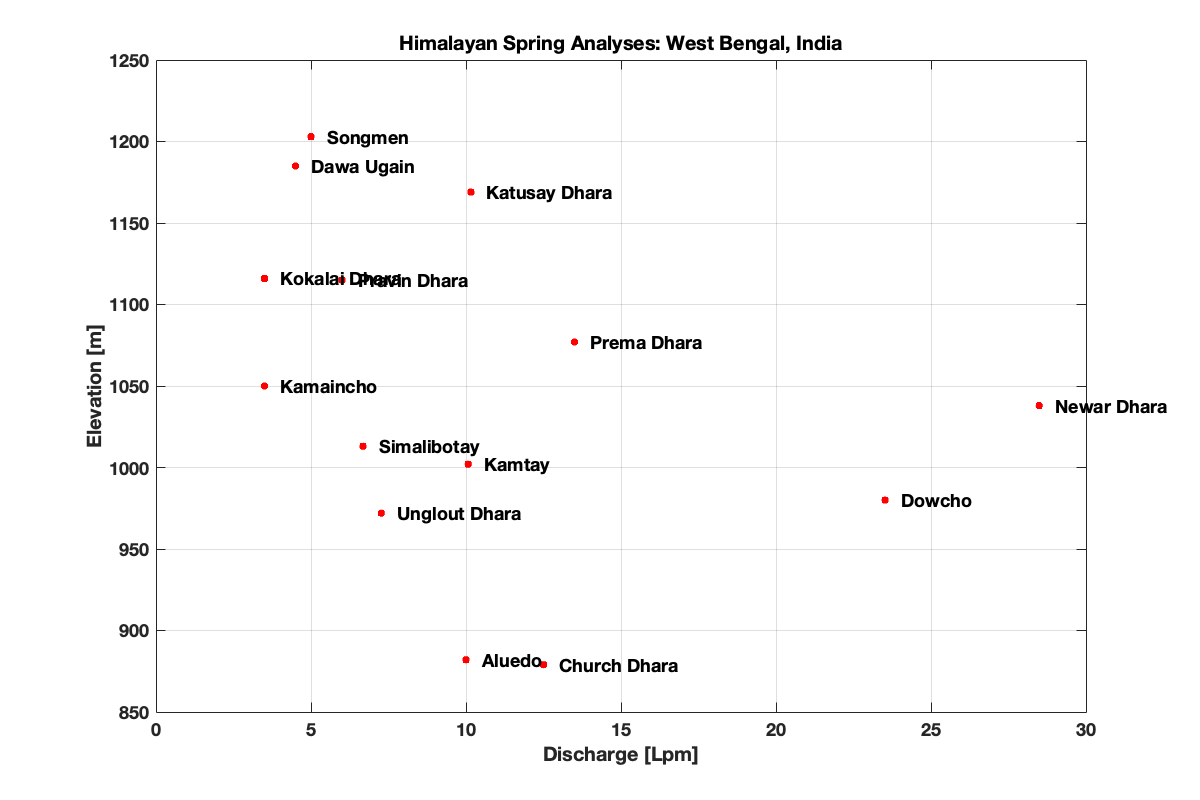
plot(q,elev,'r.','markersize',20)
grid,xlim([0,30]),ylim([850,1250])
xlabel('Discharge [Lpm]')
ylabel('Elevation [m]')
title(stitle)
for i=1:length(ph)
text(q(i)+.5,elev(i),springs(i),'fontsize',fsize,'fontweight','bold')
end
set(gca,'fontsize',fsize','fontweight','bold')
set(gcf,'Position',psize,'color','white')
Principal Components
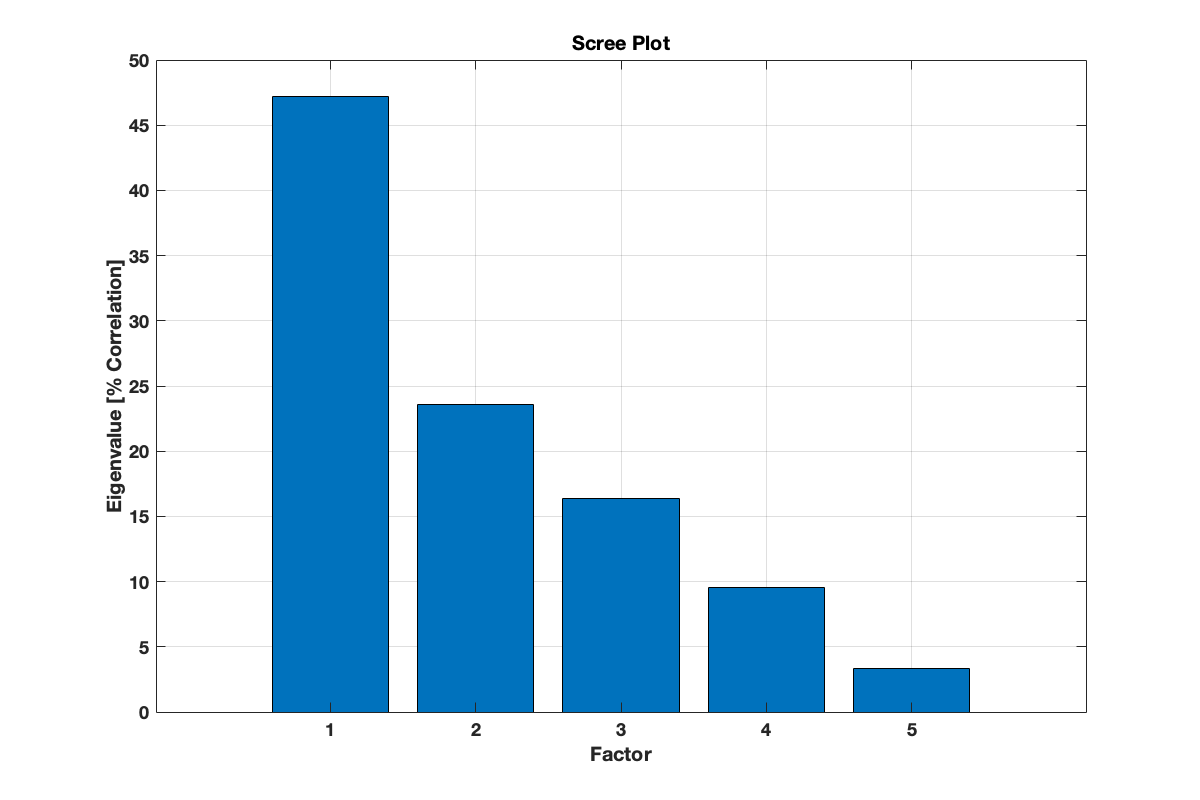
names = {'Elevation','Discharge','pH','Temperature','Electrical Conductivity'};
x = [elev,q,ph,temp,ec];
cx = corrcoef(x);
n = length(cx);
[v,d] = eig(cx);
figure
bar(flip(diag(d))*100/n),grid
title('Scree Plot')
xlabel('Factor'),ylabel('Eigenvalue [% Correlation]')
set(gca,'fontsize',fsize','fontweight','bold')
set(gcf,'Position',psize,'color','white')
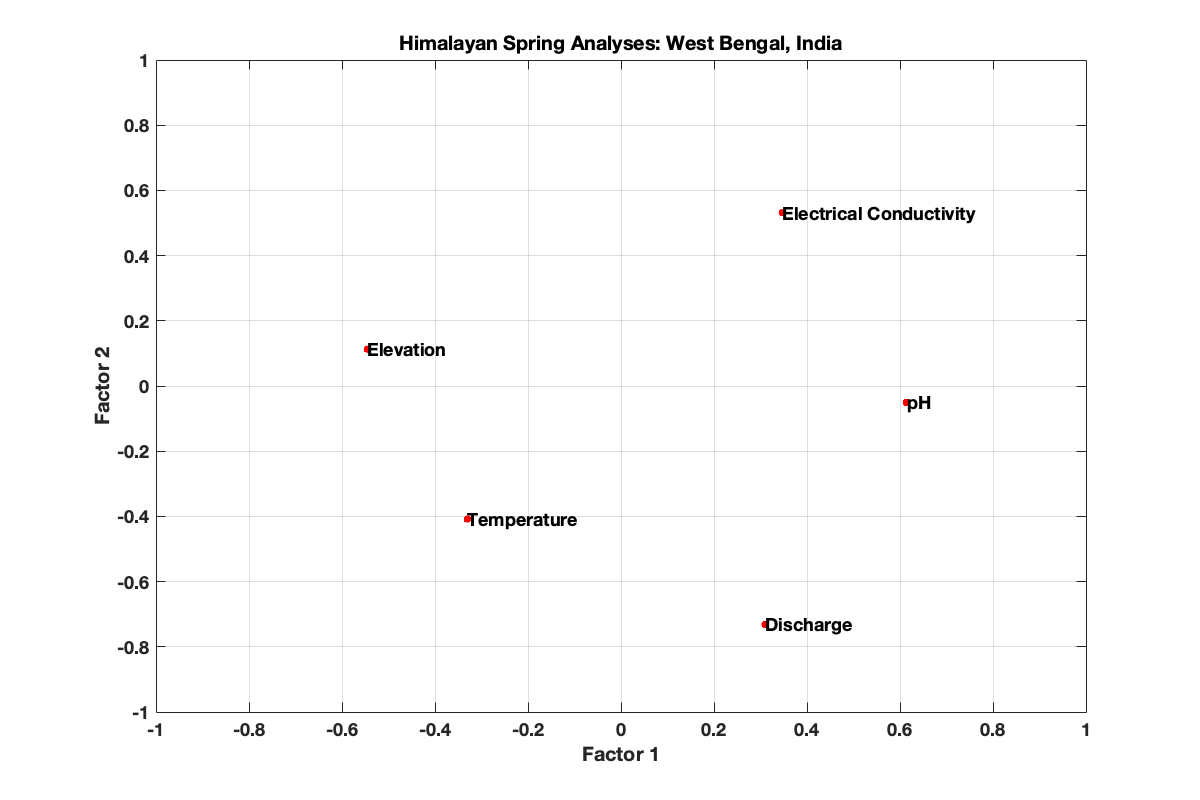
figure
plot(v(:,n),v(:,n-1),'r.','markersize',20)
xlim([-1,1]),ylim([-1,1]),grid
xlabel('Factor 1'),ylabel('Factor 2')
title(stitle)
for i=1:n, text(v(i,n),v(i,n-1),names{i},'fontsize',fsize','fontweight','bold'),end
set(gca,'fontsize',fsize','fontweight','bold')
set(gcf,'Position',psize,'color','white')
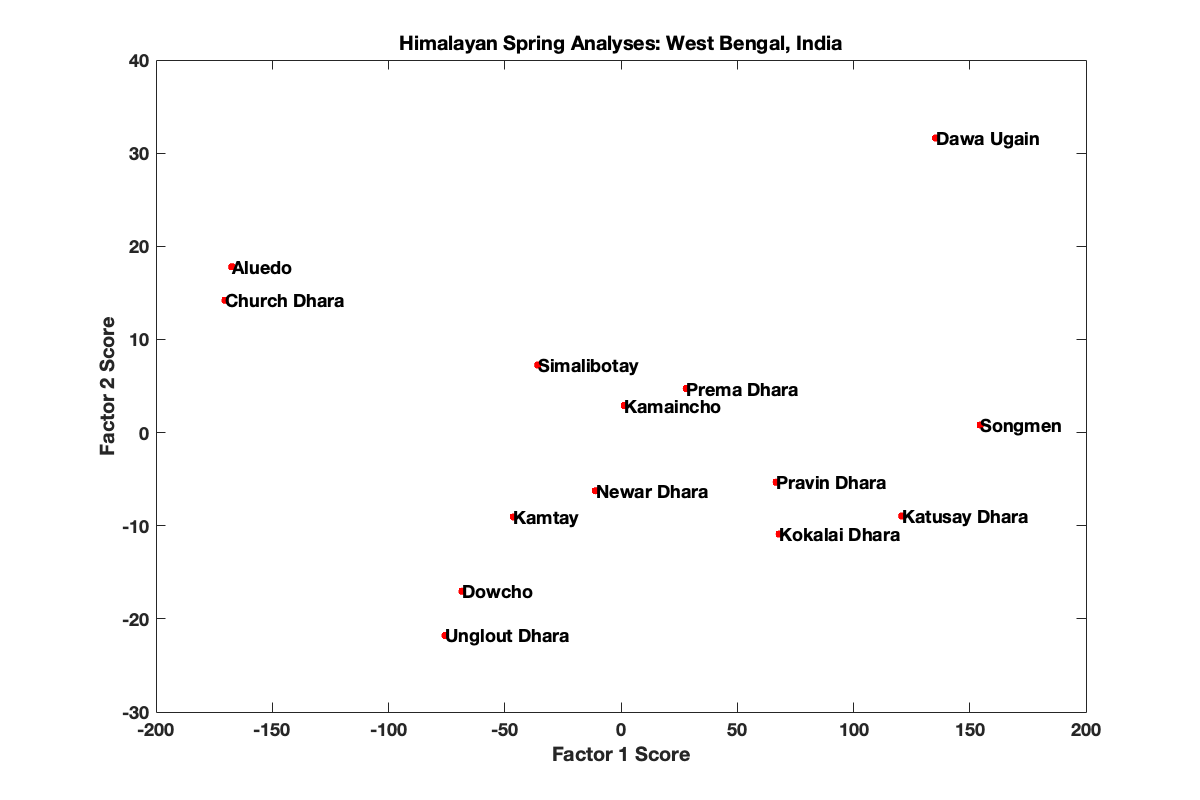
[coeff,score,latent] = pca(x);
figure, z=score; n=length(z);
plot(z(:,1),z(:,2),'r.','markersize',20)
xlabel('Factor 1 Score'),ylabel('Factor 2 Score')
title(stitle)
for i=1:n, text(z(i,1),z(i,2),springs{i},'fontsize',fsize','fontweight','bold'),end
set(gca,'fontsize',fsize','fontweight','bold')
set(gcf,'Position',psize,'color','white')
